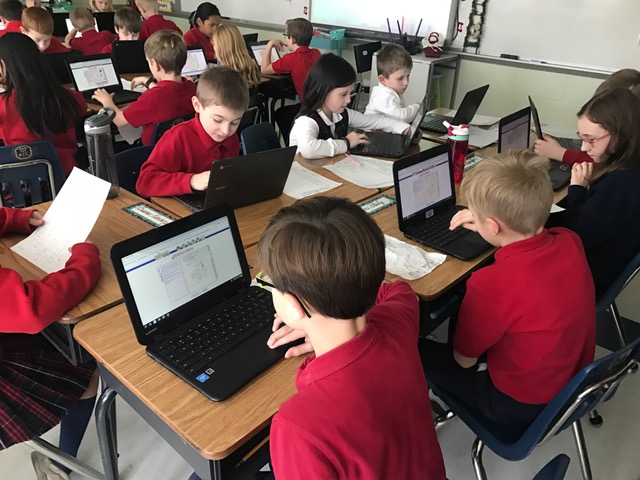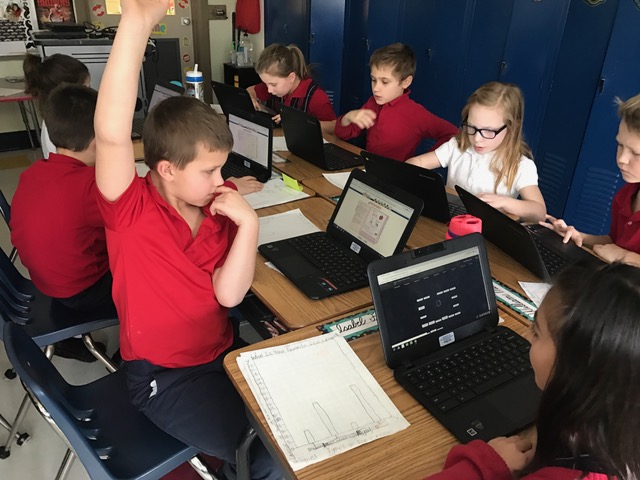


In third grade students learn how to make and read a few different types of graphs. This is a concept that reaches across Math and also dives into Science. Students in Science class created some of their own graphs in class. The first things students did was so decide on a topic to focus on and collected data from 32 other third graders. Then, the students took all their data and made their data table to organize it and decide how to graph it. Next, students took the tables and turned them into bar graphs. They choose a scale, entered a title, wrote labels, and transferred the data. Finally, students got to use a program on the computer to digitally create a graph of their own. They designed the colors, font, and look of the graph. Each student got a color copy of this graph to take home and share at home.